 Ali Mazloum
Years ago, on a project in the Gulf, a steel erection crew finished its phase without a single recordable incident. The banner went up, the team celebrated, and the record became proof that everything worked.
So was that crew safe, or just lucky? The math tells a more careful story.
The right model for counting incidents
Statisticians have a model for almost every kind of uncertainty, and the one built for counting rare events is called Poisson. It is far from new. In 1920, the statisticians Major Greenwood and George Udny Yule used this kind of model to study accidents among workers in British munitions factories.
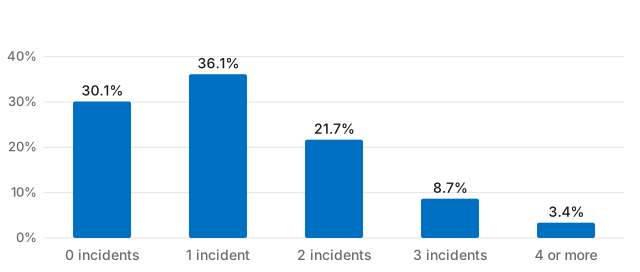
Every model rests on assumptions, and Poisson is no exception. It assumes incidents happen independently of each other, at a steady rate, and one at a time. So Poisson cannot cover a whole project, because the risk changes from one phase to the next. Excavation, steel erection, envelope and finishes all carry very different risk. This article applies Poisson to one window only: steel erection, with the same crew size, the same weekly hours, the same type of work and the same safety program throughout. Change any of these and the numbers no longer hold.
How the math works
With the window fixed, the math needs only one number: the expected number of incidents, which statisticians call lambda. Say past steel erection phases of similar size averaged 0.3 recordable incidents per month. Over a four month phase, the crew should expect 0.3 × 4 = 1.2 incidents.

Past phases only compare fairly if the exposure is the same. A crew twice the size carries twice the exposure, so raw counts mislead. The industry solves this with a rate: incidents per 200,000 hours worked, roughly what 100 full time workers put in over a year. That rate, taken from your own past phases, is where a number like 0.3 per month comes from.
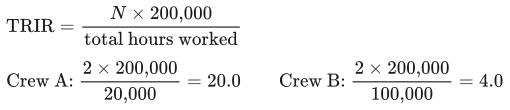
Poisson then gives the chance of every possible outcome. For zero incidents the formula is short: e raised to the power of minus lambda, where e is a fixed constant of about 2.718 found on any calculator. With lambda at 1.2, that comes to about 30%.

Nearly one in three crews carrying exactly this level of risk would finish steel erection with a perfect record purely by luck. Nothing about their conditions changed. The numbers simply fell their way. The crew under that banner in the Gulf may well have been one of them.
Where luck stops being a good explanation
Luck can explain a clean record. Can it also explain a bad one?
First, a line. By a convention dating back to statistician Ronald Fisher in 1925, a result with less than a 5% chance is usually treated as unlikely to be luck.
Here is the full picture for that same crew.
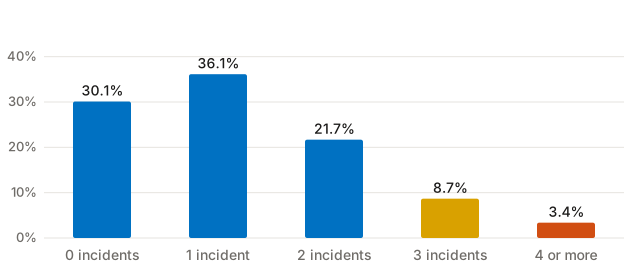
- 0 to 2 incidents: 88% combined. Normal for this crew.
- 3 incidents: 9%. Still within chance, but watch closely.
- 4 or more: 3%. Below the 5% line, so the risk has likely changed. Review the whole operation.
Three or more incidents together (9% plus 3%) still happen by chance about 12% of the time, roughly one crew in eight. Four or more happens only 3% of the time, which is where the line falls for this crew. Up to three, the count alone cannot prove the risk has changed. From four, luck becomes hard to believe.

One point, so nobody misreads this. Every incident deserves a full investigation, root cause and corrective action, every time. The table does not replace that. It only answers whether the crew's underlying risk has shifted.
The honest limits
That line is only as good as the model behind it, and Poisson has weak spots. Real sites break its rules. One event can injure several workers at once. Some workers carry more risk than others. When incident data spreads wider than Poisson predicts, statisticians switch to a wider model called the negative binomial. Greenwood and Yule saw this in their own factory data back in 1920.
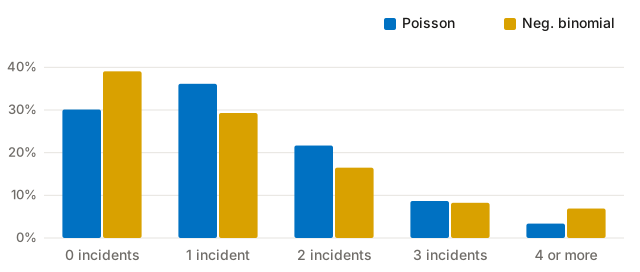
Under the wider model, four or more incidents happens about 7% of the time, above the 5% line. So even four incidents is not clear proof. A single count, high or low, proves very little on its own.
What to track instead
If a single count proves so little, a manager needs something better to watch. A clean record shows the outcome. It does not show how that outcome was achieved.
Start with near misses. A crew that reports near misses is a crew that notices danger. A crew reporting none is rarely the safest one on site. More often, people do not feel safe speaking up, do not recognize the hazards, or find reporting too much hassle. Add safety observations, toolbox talks and audit findings. Together they show whether a site is actively managing risk or simply has not been caught yet.
Zero incidents is good news worth celebrating, but it is not proof. That Gulf crew may have been safe. The banner just could not prove it. Read the record with numbers, not hope, and keep watching what happens before anyone gets hurt.
References
- Greenwood, M. and Yule, G. U. (1920). An Inquiry into the Nature of Frequency Distributions Representative of Multiple Happenings with Particular Reference to the Occurrence of Multiple Attacks of Disease or of Repeated Accidents. Journal of the Royal Statistical Society, 83, 255 to 279.
- Fisher, R. A. (1925). Statistical Methods for Research Workers. Edinburgh: Oliver and Boyd.
- U.S. Bureau of Labor Statistics. Occupational Safety and Health Definitions: Incidence Rate.
- Hollnagel, E. (2014). Safety I and Safety II: The Past and Future of Safety Management. Farnham: Ashgate.
Disagree? Good. That is what the comments are for. Tell me where this goes wrong in your experience.

Comments
Verified people only. Real names preferred.
House rules
Leave a comment